See your business clearly
 Written by Paula Chaplin
This is the time of year you start looking forward and trying to gauge what the year ahead will bring. If you happen to be in a region beset by issues (perceived or real) negatively impacting tourism (terrorism, ebola, government unrest etc) – this is probably quite a trying exercise. Unfortunately we can’t help you predict the future – our crystal ball is still downloading…
But what we can help you with is forecasting data in ResRequest – which you can interpret (because no-one knows your business like you do) and try to spot booking and travel trends, which may give you a reasonable idea of what next year will be like.
To that end – we have put together some reports (all of which you can pull out of ResRequest) – and added some graphs (we used Google Spreadsheet, but you could use Excel or Numbers) – to give you an idea of the kind of information you can get from ResRequest, and different ways of viewing it.
The numbers we’ve shown are fictional, and not representative of any company’s actual business. The point of this mailer isn’t the figures – it’s the concept of data interpretation and visualisation.
We show you below how to pull the reports which are feeding these graphs – but your company will be set up in a unique way, possibly with properties, accommodation types or rate types that should be excluded from statistical/revenue reporting. If you want to be 100% certain that you are looking at accurate and relevant data – please get in touch so we can go through it with you.
It’s important to note that our reports are only as good as the data you capture. If you are not capturing data consistently – your reports will not give you an accurate or complete picture of your business.
The information I used to create these graphs was pulled from either the Sales Analysis or, my personal favourite, the Financial Analysis Report. To find this information, and much, much more, I’ve prepared a guide on how to use the Financial Analysis Report. If you prefer that we talk you through this step-by-step just drop us an email. Enjoy!
Future bed nights: comparing previous years
Looking at what your bed nights were like this time in previous years, relative to how the year turned out. 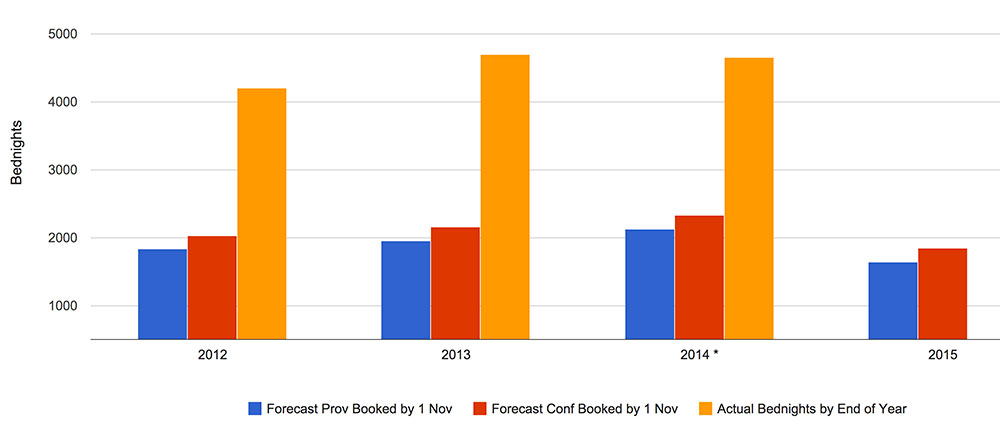 (To pull information for this graph: you need to run a report per year and stitch the information together. To see bookings as of 1 Nov 2013 for 2014: Travel Dates = 1 Jan – 31 dec 2014, Create Date = 1 Jan 2000 – 31 Oct 2013. Group by Status, showing Bednights.)
Booking lead time
Look at booking trends – how far in advance do your reservations come in. 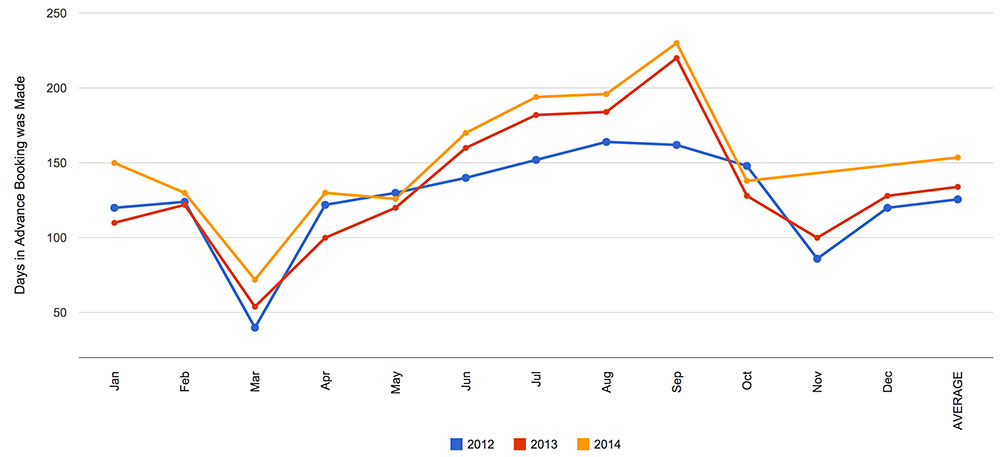 (To pull this report look at the FAR – Group by Create Date, and look at Arrival Date. Export the report and create a variance column between Arrival Date and Create Date – this is your lead time.)
Revenue compared with Yield
We know you are interested in yield, not just bed nights. By combining your revenue and yield on one chart, you can see pricing trends for each property, or year. 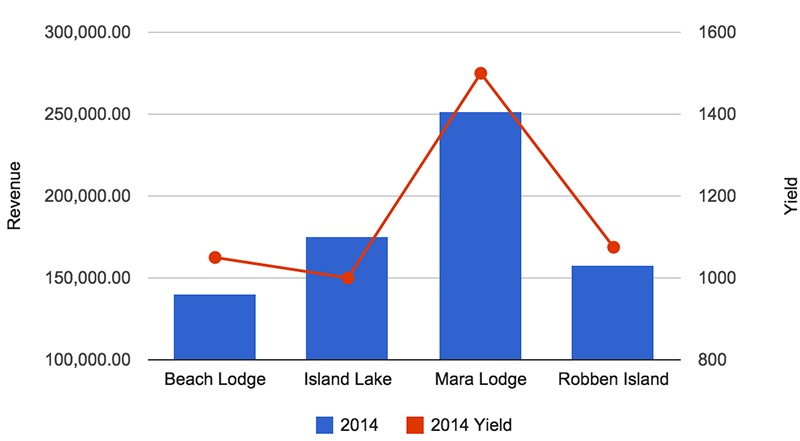
(To pull information for this bar graph, I ran the FAR report, grouped by property, showing net revenue and yield.)
Recognise your top agents
You need to know which agents are your top performers. By plotting your top agents for the last 2 years, and your forecasted agents for the next year, your marketing team can quickly see who to check-in with, or applaud.
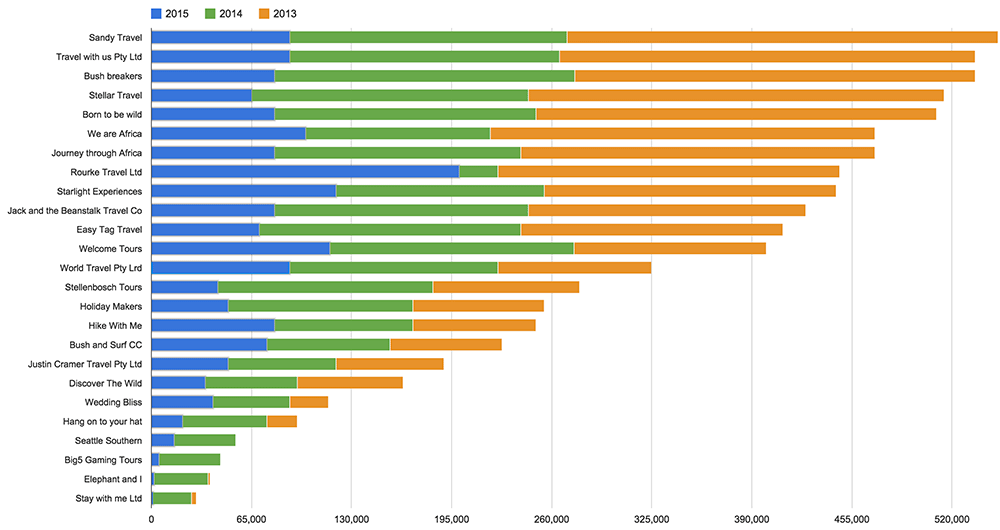
(To prepare data for this chart, I ran the FAR report, grouped by agent and sorted by revenue.)
Know where your business comes from
Knowing where your business comes from can be an effective tool as you develop your marketing and sales strategy. Measuring your reservation source shows you which campaigns were the most successful.
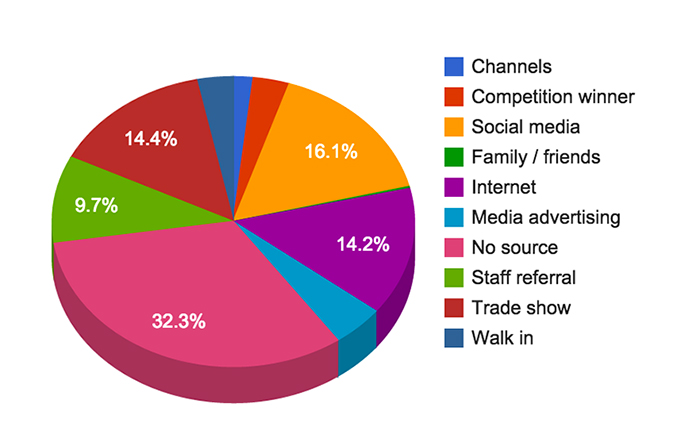
(This report was easy because my database had source code information, I generated the results using the FAR report, grouping by source code and sorted by revenue.)
Trending markets
See where your business is coming from geographically by tracking reservation nationality or tracking where your agents are based.
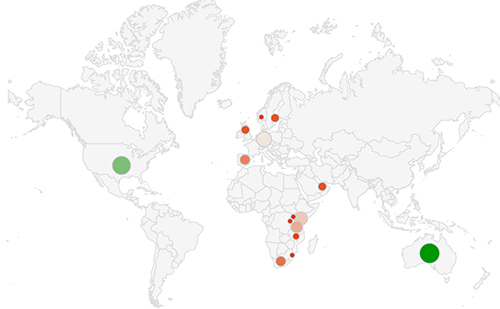
(This was super easy, I ran the FAR report, grouped by the agent postal code and sorted by revenue. The trick to this chart working is that your agents must have their postal (or physical) address details recorded!)


